API Latency Case Study: A Million Requests Kept as Ready Answers Inside SQLite
A small web service that already keeps its data in SQLite wants the usual answers about its API: how many requests each endpoint gets, how long they take on average, and the p99. The simple way is a table with a row per request, scanned whenever someone looks. In the SQL demo the service keeps a compiled Precomputing policy in the same SQLite instead, and the answers stay current on every insert.
The run covers three simulated hours, from 09:00 to 12:00 UTC on 28 September 2026, at about 100 requests a second across five endpoints. The script plants 300 slow requests along the way, and at 10:30 the checkout endpoint runs six times slower for two minutes. To have something to compare with, every request also goes into a plain table.
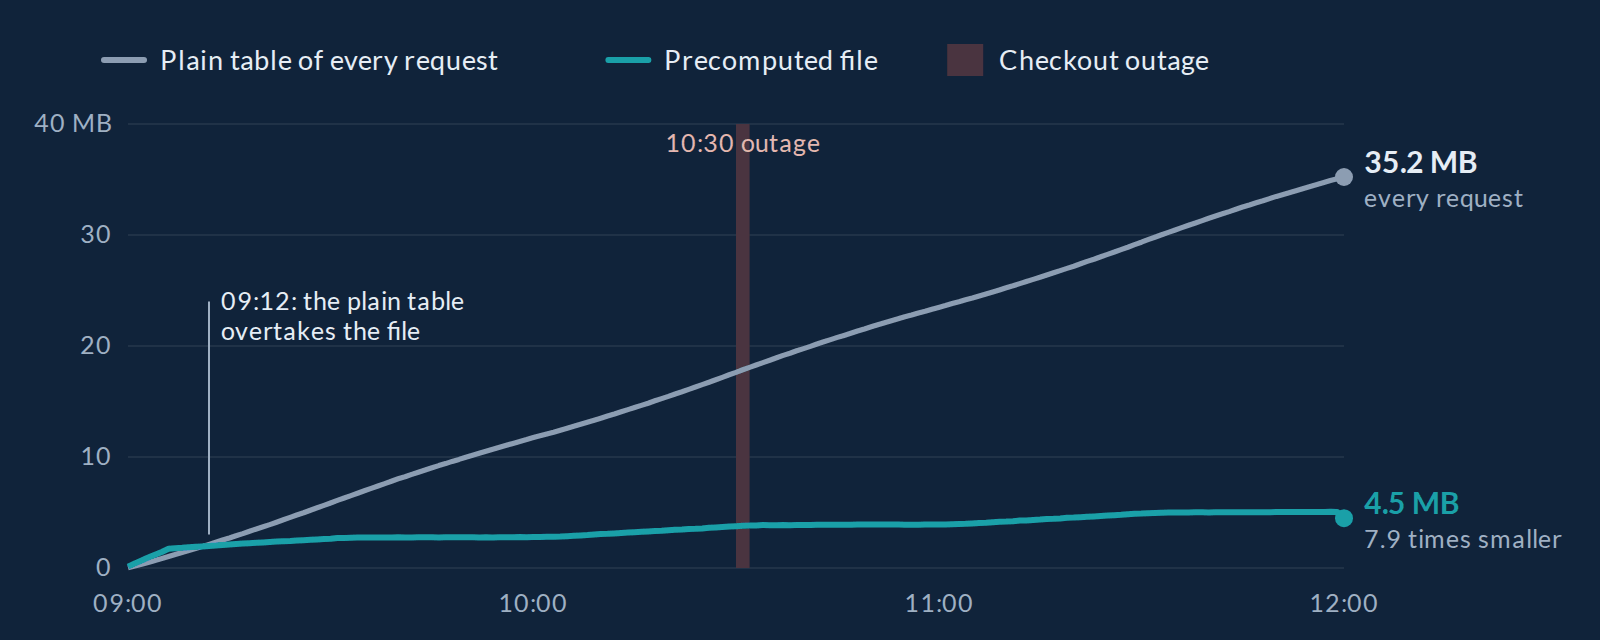
The three hours as the demo measured them: SQLite pages in use, minute by minute, for the plain table and for the precomputed file.
The Set-Up
| API latency | |
|---|---|
| Service | Five endpoints: /api/search about 30 ms, /api/login 45 ms, /api/cart 80 ms, /api/checkout 120 ms, /api/report 250 ms |
| Traffic | About 100 requests a second, 1,080,198 in three hours, one event each: time, endpoint, milliseconds |
| Kept | Whole requests for 5 minutes; summaries at 10 seconds for a day, 1 minute for a month and 1 hour for a year; p99 sketches; three samples a minute; unusual requests |
| Ready answers | Requests, average and p99 per endpoint, as three views |
| Runtime | The compiled policy, 147 lines of SQL, in SQLite 3.53.4’s WebAssembly build |
The whole integration is an insert per request and a select per question:
INSERT INTO latency (ts, endpoint, ms) VALUES (1790586000, '/api/search', 31.5);
SELECT * FROM p99_ms;
What Happened
- 09:00. Requests start. For the first minutes the precomputed file is the larger of the two: each new window and sketch costs space up front.
- 09:05. The first requests are five minutes old and leave the raw tier. From here on detail fades into summaries.
- 09:12. The plain table overtakes the file, and stays larger to the end.
- 10:30.
/api/checkoutruns six times slower. Of its 1,395 requests in the next two minutes, 1,111 are flagged as unusual and 40 are kept whole, twenty a minute, the cap the policy sets. - 10:32. Checkout recovers, and its unusual count drops back to zero in the next minute.
- 12:00. The run ends: 1,080,198 requests, a plain table of 35.2 MB and a precomputed file of 4.5 MB.
The outage stays flagged for its whole two minutes because the baseline behind the anomaly rule does not learn from unusual requests. A baseline that learned from everything would have called the outage normal within seconds.
What the File Can Answer
The ready answers, one row per endpoint, read from three views:
sqlite> SELECT r.endpoint, r.value AS requests, round(a.value, 2) AS avg_ms, round(p.value, 1) AS p99_ms
   ...> FROM requests r JOIN avg_ms a USING (endpoint) JOIN p99_ms p USING (endpoint) ORDER BY requests DESC;
endpoint       requests  avg_ms  p99_ms
/api/search      377840   31.96    67.4
/api/cart        270772   85.26   179.5
/api/login       162399   47.97   100.5
/api/report      161468  293.26   620.3
/api/checkout    107719  136.47   572.6
The outage, minute by minute, from the 1-minute summaries that will stay for a month:
sqlite> SELECT time(w, 'unixepoch') AS minute, n AS requests, an AS unusual, round(ms_sum / n, 1) AS avg_ms
   ...> FROM latency_win WHERE res = 60 AND endpoint = '/api/checkout' AND w BETWEEN 1790591340 AND 1790591580;
minute    requests  unusual  avg_ms
10:29:00       719        0   128.2
10:30:00       706      576   760.5
10:31:00       689      535   769.4
10:32:00       658        0   128.3
10:33:00       653        0   126.1
The slowest minutes of the three hours come from the p99 sketches, and the outage tops the list at 1,620 ms. Every query here runs on the file as the demo leaves it, and the demo’s “Ask the file” box has them ready.
The Numbers
| Over three hours | Result |
|---|---|
| Requests | 1,080,198 |
| Plain table of every request | 35.2 MB |
| Precomputed file | 4.5 MB, 7.9 times smaller |
| Of the file, the last five minutes kept whole | 1.2 MB |
| Counts and averages | Exact |
| Largest p99 difference from the exact value | 0.64% (on /api/report) |
| Planned slow requests kept whole | 300 of 300 |
| Unusual requests kept whole in all | 340 |
| Reading all 15 answers | 2 to 5 ms from the views; 2 to 3.5 seconds from the plain table |
From a headless run of the demo’s own code with the page’s SQLite build. The p99 differences are 0.19% to 0.64%; the policy promises 1%.
What the Demo Revealed
Two changes came out of testing. The first version kept whole requests for ten minutes, and that tier with its time index was 43% of the file; five minutes is enough to look at a moment in full, so the demo keeps five. And the first anomaly baseline learned from every request, so an outage looked normal after a few seconds. The baseline now ignores unusual requests and caps how far any request can move it.
A third point is still open. The sketch buckets are more than half of the file, because each is stored as its own row. Packing each window’s buckets into one value is planned for 0.2 and should make the file noticeably smaller, with the same answers.
Next: On Real Traffic
The compiled SQL needs nothing but SQLite, so a pilot can run inside an application that already uses it: a web service, a phone app, a Cloudflare Durable Object with its own SQLite. The questions for a pilot are practical ones. How does the file behave over months, and which answers do people ask for that the policy did not plan?
Try It Yourself
Open the SQL demo, press Play and start an outage on any endpoint while it runs. Three hours pass in about a minute on a recent computer. At the end, every answer sits next to the exact value from every request, and the file is yours to query or download.