The Platform
Precomputing 0.1 is one policy language and one SQLite file format, with two runtimes that keep the file current and two products built on them. The SQL runtime compiles a policy into plain SQLite triggers. The Engine runs the same policy in a Go binary with SQLite built in. The Meter counts usage for billing, exactly, and Logs keeps a log dashboard’s answers ready while the raw lines stay on site.
Four live demos run the real code in your browser on simulated data: API traffic, a trading day, a month of AI usage and a web shop’s logs. The data is invented; the code and every check are real. The engines are not public yet, so the demos are the way to see them run.
Where it stands. Version 0.1, complete for what it covers and checked hard on simulated data. Next it needs real traffic from teams who try it.
- 7.9 times smaller: three hours of API traffic kept as ready answers, with every p99 within 0.65% of the exact value.
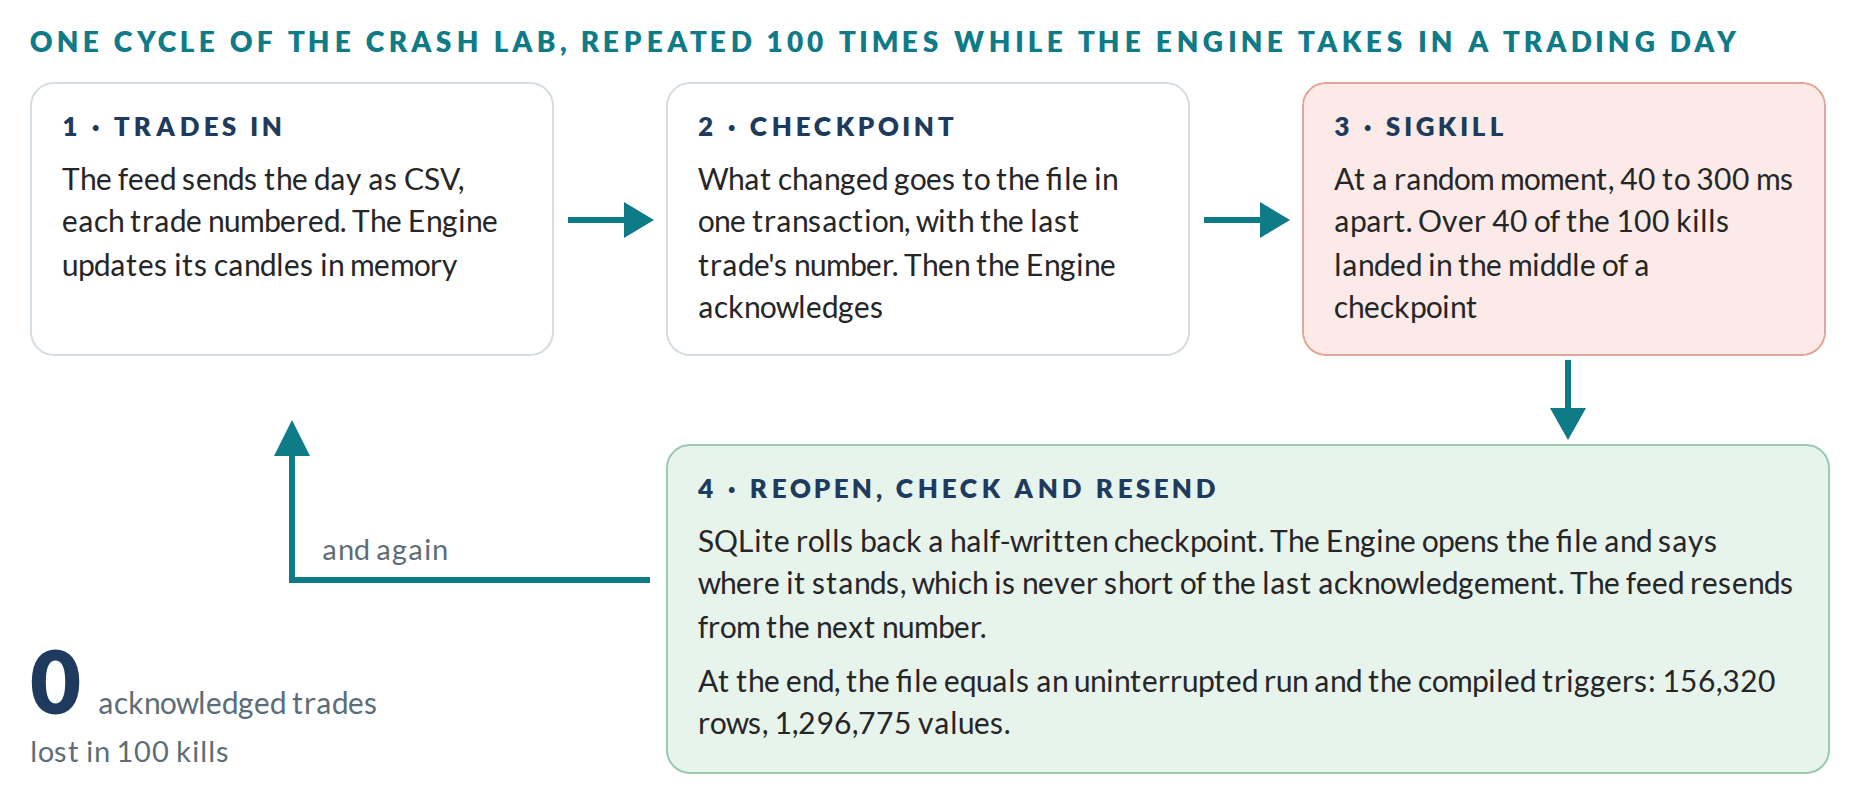
- 100 kills: the Engine stopped without warning while it takes in a trading day, with no acknowledged trade lost.
- $5,804.56: a month of AI usage invoiced, equal to a separate recount to the billionth of a dollar.
- 120 times fewer bytes: a log dashboard sent upstream, with every count and sum still equal to the raw lines and every p95 within 1%.
On this page: In brief · The language · The file · SQL · Engine · Meter · Logs · Tests · Features and limits · Where it stands
The Platform in Brief
| Part | Status | Key figures |
|---|---|---|
| Language | Complete for 0.1 | Streams, rollups, quantile sketches, samples, kept anomalies and precomputes; exact streams, quotas and streams from logs |
| SQL runtime | Complete | A policy compiles to tables, views and one trigger per stream. Runs in SQLite 3.35 or newer with the math functions, including in the browser |
| Engine | Complete | One Go binary of about 13 MB with SQLite 3.53.4 built in; 5.0 MB for the browser, 1.3 MB compressed. 12 to 17 times faster than the triggers on Demo 2’s trades |
| Meter | Complete for 0.1 | Retries counted once, late reports placed in their hour, months that close, quotas read in 10 to 13 µs |
| Logs | Complete for 0.1, with no forwarder yet | Templates learned with Drain, a dashboard imported as a policy, every line kept on site for 48 hours |
| Tests | Extensive, on simulated data | Engine and triggers compared value for value; 100 kills in the crash lab; Drain’s published accuracy on all 16 Loghub datasets |
| Demos | Four, simulated data | 1,080,198 requests, 4,048,210 trades, 373,351 usage reports and 281,164 log lines, each run checked against a recount |
| Code | Not public yet | About 9,400 lines of Go and 2,000 lines of Go tests. The license will be chosen before the first public release |
| Readiness | Alpha | Validated on simulated data. Not yet run on anyone’s production traffic |
One Language
A policy is a short text file that says which streams of events exist, which answers to keep ready and how long each level of detail lives. The compiler checks it and refuses a mistake with its line and a plain message.
stream latency {
  key   endpoint text
  value ms real

  raw     keep 5m
  rollup  10s keep 24h
  rollup  1m  keep 30d  quantiles ms
  rollup  1h  keep 1y   quantiles ms

  samples 3 per 1m
  anomalies ms log z > 4 keep 20 per 1m
}

precompute p99_ms = p99(latency.ms) by endpoint
That is Demo 1’s policy with one of its three precomputes. The whole policy compiles to 147 lines of SQL. The language has two ways of keeping detail. Streams let detail fade on a schedule, while unusual events stay whole. Exact streams keep every event until a business deadline has passed, such as an invoice that can no longer be disputed. The policy language explains every line.
One File
Every runtime writes the same SQLite layout: a raw table, a table of window summaries, the sketch buckets, samples, kept anomalies and one view per precompute. The file also holds its own policy and the statements that let old detail fade, so any SQLite tool can open it and understand it. The Engine’s file and the triggers’ file are the same, value for value, and either runtime can carry on in a file the other wrote. The file, table by table
The SQL Runtime
The compiled SQL runs inside any SQLite database. Events go in with INSERT, and the triggers keep every answer current on the same insert. Nothing else runs. Demo 1 measures it on three simulated hours of API traffic for a small web service, five endpoints at about 100 requests a second:
| What | Result |
|---|---|
| The three hours | 1,080,198 requests, with 300 planned slow requests and a two-minute outage |
| Storage | 4.5 MB for the precomputed file against 35.2 MB for a plain table of the same requests: 7.9 times smaller. Of the file, 1.2 MB is the last five minutes kept whole |
| Accuracy | Counts and averages exact. Every p99 within 0.65% of the exact value |
| Unusual requests | All 300 planned slow requests kept whole. During the outage, 1,111 of 1,395 requests flagged and 40 kept whole under the 20-a-minute cap |
| Reading | All 15 answers in 2 to 5 ms from the precompute views, against 2 to 3.5 seconds from the plain table |
From a headless run of the demo’s own code with the page’s SQLite WebAssembly build. The same answers were checked again in native SQLite.
The Engine
The Engine runs the policy in memory and writes what changed to the file at every checkpoint, in one transaction. Senders number their events. The file records the last number it holds from each sender in the same transaction, so after a crash a sender resends from there: nothing is lost and nothing counts twice. Measured on a shared two-core cloud server (Intel Xeon at 2.8 GHz). Speeds there change from one day to the next, in some runs by a third or more, so they are given as the range of our runs:
| Run | Result |
|---|---|
| Demo 2’s trading day on the command line, 4,048,210 trades, into a file on disk with a full sync every 10,000 trades | 12 to 16 seconds in our runs, 258,000 to 337,000 trades a second. Every closed candle and the quote board identical to a recount of every trade |
| The first 200,332 trades through the Engine and through the compiled triggers | 450,000 to 570,000 against 26,700 to 37,000 trades a second, 15 to 17 times faster. The two files: 122,793 rows, 576,218 values, identical |
| The crash lab: the Engine killed without warning 100 times while it takes in the day | Over 40 kills in the middle of a checkpoint (42 and 45 in two runs). Acknowledged trades lost: 0. The final file identical to an uninterrupted run and to the triggers: 156,320 rows, 1,296,775 values |
| Demo 2 in Chromium on the same machine | 170,000 to 220,000 trades a second while writing the file five times a second. Back from a pulled plug in about 0.2 seconds |
The crash lab kills the Engine with SIGKILL 40 to 300 milliseconds apart, restarts it, checks that the file never holds less than the last acknowledgement, and resends from where the file stands.
The Meter
The Meter is an exact stream with precomputes by customer and month, and a quota. Retried requests are refused by their id, late reports count in the hour they happened, and a month closes a day after it ends. Prices sit in the same file, so an invoice is one SQL view over totals that are already added up. Demo 3 runs a month of invented AI usage: six customers on three plans, three models and two gateways.
| What | Result |
|---|---|
| The month | 366,118 requests served and 373,351 reports sent, retries included |
| Retries | 7,219 reports refused as repeats. No request id appears twice in the file |
| A six-hour outage | 625 held reports delivered when the link came back, each counted in its own hour |
| A queue stuck at the month’s end | 642 reports delivered after September closed, all refused as closed. The invoices did not change |
| September’s invoices | $5,804.56 due against $3,337.84 of model cost. Every line and amount equal to a separate recount, to the billionth of a dollar |
| Late reports | All 8,215 hourly windows equal to the recount, request for request and token for token |
| A quota check | One read of a view: 10 to 13 microseconds in WebAssembly |
| The file | 25.3 MB at the end of the month, 1.9 MB after the dispute window, with the invoices unchanged |
| Natively | The Engine takes the same reports in 2.3 to 3.3 seconds, 113,000 to 162,000 a second. Its tables equal the ones the browser’s SQL runtime wrote, value for value: 453,536 rows, 2,949,652 values. Only the price list and quota limits the demo adds are left out |
Logs
The log reducer sits next to the services that write the logs. It learns what kind of line each line is, keeps every line in a local file for 48 hours, and keeps ready the answers a dashboard shows. Upstream go those answers, the error lines, a few examples and any new kind of line. Demo 4 runs two hours of an invented web shop’s logs, about 39 lines a second on average.
| What | Result |
|---|---|
| The two hours | 281,164 lines, 25.5 MB, 19 templates |
| Sent upstream | 212 KB in 124 batches and 7,896 events: 120 times fewer bytes and 36 times fewer events than the lines |
| The dashboard, drawn from what was sent | 6,231 counts and sums identical to a recount of the raw lines, 840 p95 values within 1%, the top 10 searches identical |
| The payment incident | Caught as a new ERROR template 2 seconds after its first line |
| At Datadog’s list prices | About $173 a month with every line upstream, $4.84 with what was sent (list prices checked 29 September 2026) |
| Kept on site | All 281,164 lines in a 39.8 MB file. A search for one word over all of them takes 0.1 to 0.2 seconds |
| Natively | precomputing put --lines takes the same lines in 1.8 to 2.6 seconds, 108,000 to 156,000 a second |
Templates are learned with Drain, a published online log parser. The Go port follows the reference implementation step by step. On each of the 16 Loghub samples of 2,000 lines, with the published settings, its grouping accuracy equals Drain’s published figure:
| Dataset | Accuracy | Dataset | Accuracy |
|---|---|---|---|
| HDFS | 0.9975 | Linux | 0.6900 |
| Hadoop | 0.9475 | Android | 0.9110 |
| Spark | 0.9200 | HealthApp | 0.7800 |
| Zookeeper | 0.9665 | Apache | 1.0000 |
| BGL | 0.9625 | Proxifier | 0.5265 |
| HPC | 0.8870 | OpenSSH | 0.7875 |
| Thunderbird | 0.9550 | OpenStack | 0.7325 |
| Windows | 0.9970 | Mac | 0.7865 |
The average is 0.8654, the published figure. Sources: the Drain paper, Drain’s results on Loghub and Loghub.
Tests
Every test runs on simulated data, except the Drain check, which uses the public Loghub samples. All pass.
| Suite | What it checks | Result |
|---|---|---|
| Parser and compiler | Every example policy compiles to the expected SQL; every mistake is refused with its line and a clear message | Pass |
| Engine against the triggers | The same events through the compiled triggers and through the Engine, with late events, zeros, price jumps and day boundaries among them; the two files compared value by value | Identical. Three small deliberate changes to the Engine’s rules each make the comparison fail, so it is a real check |
| Hand-over | A file filled by the triggers carried on by the Engine, and the other way round | Identical to a file made by one runtime alone |
| Crashes in the tests | The Engine stopped at random points of three workloads and resumed from its file | Identical to an uninterrupted run |
| The crash lab | A native process killed with SIGKILL 100 times while it takes in the trading day | 0 acknowledged trades lost; final file identical |
| Exact streams | Repeats, late reports and closed months, in the Engine and in the triggers | Identical, refusals included |
| Logs | The reducer against the compiled triggers; stopped without warning again and again; fast paths against the regular expressions they replace | Identical, templates included |
| Drain | The 16 Loghub datasets with the published settings | Accuracy equal to the published figure on every dataset |
| The four demos | Each run checked by separate code that recounts from the events as they were sent and never reads the file | 0 differences |
Features and Limits
| Feature | What 0.1 supports | Limits |
|---|---|---|
| Streams | Keys, values and derived values; raw events kept for a set time; rollups of any length | Values are numbers and may not be null. Time in seconds, periods in UTC |
| Answers | count, sum, avg, min, max, first, last and any percentile, by keys, per hour, day or month | Percentiles within 1% by default, from quantile sketches |
| Unusual events | Kept whole against a running baseline per key, by level or by step | One anomaly rule per stream |
| Exact streams | Repeats refused by id, late limit, closing periods, raw events kept through a dispute window | No percentiles. A clock that goes by event times, so senders need correct clocks |
| Quotas | A limit beside any per-period sum or count, read as one view | Events over the limit are still counted, because they happened |
| Logs | One line format per policy, key=value fields, templates per service and level, dashboard import | JSON lines are read as text. Import reads count, rate, sum, avg, min, max, percentiles and top lists |
| Runtimes | Compiled triggers in any SQLite 3.35 or newer with the math functions; the Engine on the command line, over HTTP and in the browser | One writer per file. The HTTP server has no authentication |
| Changes | A file keeps the policy it was made with | To change a policy, start a new file |
Where It Stands
Maturity by Part
| Part | Maturity | Evidence | Gap to close |
|---|---|---|---|
| Language and compiler | Working, tested | Golden tests for every example; errors refused with clear messages | Feedback from policies other people write |
| SQL runtime | Working, tested | Demo 1; native SQLite check; same file as the Engine | Measured inside more hosts, such as phones and Cloudflare Durable Objects |
| Engine | Working, tested | Equivalence tests, the crash lab, Demo 2 | Real feeds, long runs, memory with many keys |
| Meter | Working in simulation | Demo 3 checked to the billionth of a dollar; native and browser files equal, value for value | A pilot with real usage and real invoices |
| Logs | Working in simulation | Demo 4; Loghub accuracy as published | A forwarder, an OpenTelemetry Collector plug-in, JSON lines |
| Security | Not started | None | Authentication for the HTTP server |
| Use in the field | None | None | Pilots |
Against the Alternatives
| Part | What already exists | What Precomputing adds |
|---|---|---|
| SQL runtime | SQLite triggers written by hand as materialized views; Turso’s live materialized views, experimental, with no windows or retention | Rollups, sketches, kept anomalies and retention from a few declared lines, in any SQLite, with nothing new to install |
| Engine | PocketBase, Go and SQLite in one file as an application backend; RRDtool-style rollups in their own formats | The same policy as the SQL runtime at native speed, in an ordinary SQLite file, with sequence numbers for crashes |
| Meter | Billing platforms such as OpenMeter, Lago, Metronome and Orb; LiteLLM budgets on counters and a database | Exact counting in the same language and file as everything else, inside your own SQLite. It counts usage, and billing stays with a billing system |
| Logs | Pipelines such as Cribl, Grepr, Sawmills and Observo; Grafana Adaptive Logs; OpenTelemetry’s log deduplication processor and signal-to-metrics connector | Reads a dashboard to decide what to keep ready, and keeps every line on site in a file you can search |
The fair reading: each field already has tools that are larger and more proven. Precomputing’s case rests on one language and one file across all four jobs, and so far it has been shown on simulated data only.
Technical Risks
- One writer per file. Senders report to one Engine process or into one SQLite database that runs the triggers. Reads can run alongside.
- Clocks in exact streams. An exact stream’s clock is the newest event time it has counted. One report stamped far in the future moves that clock for every sender and could close a month early, so senders need correct clocks.
- Many keys. The Engine keeps one baseline per key in memory and reads the newest window of every key when it opens. A key such as a user id, with millions of values, makes both memory and the file grow.
- The last bit of a logarithm. Sketches and log anomalies use the logarithm, whose last bit can differ between platforms. For Demo 3 the native Engine and the browser’s SQL runtime wrote the same values in every table; for Demo 4 one value out of 1,794,042 differs by two units in the last place.
- Logs depend on the format. A line that does not match the policy’s format is counted and skipped. Templates depend on masking identifiers well, and JSON lines are read as plain text.
- No authentication. The Engine’s HTTP server has none. It belongs on localhost or behind a proxy that has it.
Every figure on this page was measured on the 0.1 code in September 2026 unless it is marked otherwise. The prototype includes the commands that reproduce the native and headless figures, and the demo pages show the browser figures as they run.