Market Data Case Study: Four Million Trades Turned Into Candles, Checked After a Pulled Plug
A stock chart is made of candles: for each minute, the first price, the highest, the lowest and the last, with the volume traded. A candle is a window summary, the same kind of summary Precomputing keeps for API latency, only in a field every investor knows. In the Engine demo a trading day of stock trades goes through the Engine, which keeps 1-second, 1-minute and 1-hour candles and a quote board ready in its SQLite file, and writes the file five times a second.
The run covers one simulated trading day, 28 September 2026 from 09:30 to 16:00 New York time, for eight invented symbols. News lifts SIM4 by 8% at 11:02:17, SIM8 is halted at noon and reopens 3.5% lower, and SIM6 drops 6% at 14:31:05. At 13:15 the demo throws the Engine away in the middle of writing its file.
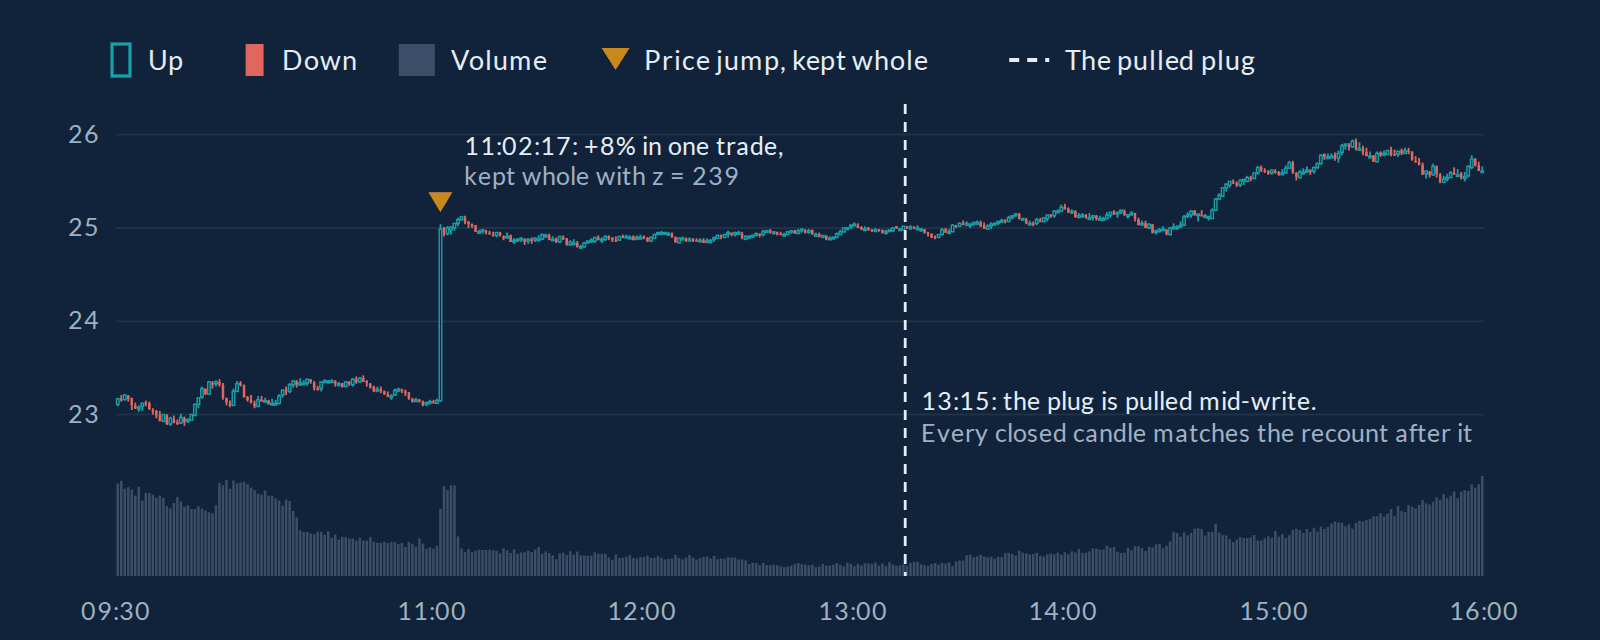
SIM4’s day as the Engine’s file holds it: 390 one-minute candles, read with SQL.
The Set-Up
| Market data | |
|---|---|
| Market | Eight invented symbols, SIM1 to SIM8, busy at the open and the close and calm at lunch; 4,048,210 trades in the day |
| Kept | Every trade whole for five minutes; candles at 1 second for an hour, 1 minute for 90 days and 1 hour for good |
| Ready answers | A quote board of eight precomputes: last price, the day’s open, high, low, volume, turnover and trades per symbol, and a total |
| Unusual trades | Each trade judged by its step from the previous trade of the same symbol; far outside the usual steps, it is kept whole |
| Runtime | The Engine, compiled to WebAssembly, writing into SQLite 3.53.4’s WebAssembly build five times a second |
Every candle comes from the same summary columns. Open is price_first, high price_max, low price_min, close price_last, volume size_sum, and VWAP is notional_sum / size_sum, where the policy derives notional = price * size for each trade.
What Happened
- 09:30. The open, the busiest stretch of the day. The Engine takes in each trade, updates its candles in memory and writes what changed to the file five times a second.
- 11:02:17. SIM4 jumps 8% in one trade, from about 23.15 to 25.02. The Engine keeps that trade whole with a z-score of 239, and judges the trades after it from the new price, so none of them is flagged.
- 12:00 to 12:10. SIM8 is halted. It reopens 3.5% lower, and the first trade after the halt is caught the same way.
- 13:15. The plug. The Engine is thrown away in the middle of a checkpoint, with every trade since the last one in memory. SQLite rolls the half-written checkpoint back. A fresh Engine opens the file in well under a second, reads where the feed stands, and the feed resends every trade after that. The candles are checked right away and match the recount.
- 14:31:05. SIM6 drops 6%. Caught, kept whole, z-score −610.
- 16:00. The close. The day ends with every closed candle and the whole quote board equal to a recount of every trade.
How many trades the plug throws away depends on the moment: a pull at 13:15 typically catches tens of thousands in memory and a checkpoint of about ten thousand rows half written. None of them is lost, because none had been acknowledged, and the feed still had them.
What the File Can Answer
The quote board at the close, read from the precompute views:
symbol  last    open    high    low     volume     trades
SIM1    185.69  187.40  188.57  183.59  296729493  914944
SIM2    64.32   64.26   64.78   63.27   251147498  777593
SIM3    408.44  412.77  414.92  403.06  200335637  617625
SIM4    25.61   23.11   25.96   22.88   174335302  537394
SIM5    99.69   98.61   99.80   97.02   140549448  434536
SIM6    138.08  145.29  146.32  135.77  114578542  353743
SIM7    31.32   31.76   32.04   31.03    81017889  252087
SIM8    52.10   52.90   53.84   50.60    51858071  160288
SIM4 around its jump, in 1-minute candles with their VWAP:
sqlite> SELECT time(w - 14400, 'unixepoch') AS minute,
   ...>   printf('%.2f', price_first) AS open, printf('%.2f', price_max) AS high,
   ...>   printf('%.2f', price_min) AS low, printf('%.2f', price_last) AS close,
   ...>   CAST(size_sum AS INTEGER) AS volume, printf('%.2f', notional_sum / size_sum) AS vwap
   ...> FROM trades_win WHERE res = 60 AND symbol = 'SIM4' AND w BETWEEN 1790607660 AND 1790607780;
minute    open   high   low    close  volume   vwap
11:01:00  23.12  23.17  23.12  23.15   350961  23.15
11:02:00  23.15  25.04  23.14  24.99   788771  24.82
11:03:00  25.00  25.01  24.91  24.94  1056240  24.96
And the three price jumps of the day, kept whole with their z-scores:
time      symbol  price   z
11:02:17  SIM4     25.02   239
12:10:00  SIM8     51.03  -231
14:31:05  SIM6    136.48  -610
The Numbers
| Over one trading day | Result |
|---|---|
| Trades | 4,048,210 |
| Candles checked against a recount in the browser | 27,150 at 1 second, 1 minute and 1 hour: 0 differences |
| The quote board | Identical to the recount |
| The Engine’s file at the close | About 10 MB, against an estimated 115 MB for a plain table of every trade, measured on the first 100,000 trades and scaled to the day |
| The Engine in the browser | 170,000 to 220,000 trades a second in Chromium, writing the file five times a second |
| The Engine against the compiled triggers, first 200,332 trades, both in WebAssembly | 12 to 15 times faster; the two files identical |
| The native Engine, whole day, full sync every 10,000 trades | 12 to 16 seconds in our runs, 258,000 to 337,000 trades a second, every closed candle identical |
| The crash lab: native Engine killed 100 times while it takes in the day | 0 acknowledged trades lost; final file identical to an uninterrupted run |
Browser figures from a headless run of the demo’s own code and from Chromium, on a two-core cloud server (Intel Xeon at 2.8 GHz); native figures from the command-line Engine and the crash lab on the same server.
What the Demo Revealed
A price jump is a hard case for an anomaly rule. Judged by level, every trade after the jump sits far from the old baseline, so a rule would flag hundreds of ordinary trades until the baseline caught up. The policy language gained change for this: the baseline learns the usual steps between trades, and only the step itself is unusual. In the demo each of the three jumps is flagged exactly once.
The plug also showed why sequence numbers belong in the file. The Engine records the last trade the file holds in the same transaction as the candles, so a crash can never leave the two out of step. Without that, a resend after a crash would count some trades twice.
Next: On Real Traffic
The Engine reads events from standard input, from files or over HTTP, so a pilot can feed it from an existing market data handler or any event stream that needs answers faster than SQL triggers give them. The open questions are memory over long runs with many keys, and speeds on named hardware other than one cloud server.
Try It Yourself
Open the Engine demo, press Play and pull the plug around the open, when the Engine holds the most trades in memory. Then pause and run the race against the compiled SQL. At the end, every closed candle is checked against a recount, and the file is yours to query or download.